How we tackled it.

We designed and delivered a Power BI dashboard that transformed how the organisation manages its power infrastructure.

At the core of the solution:
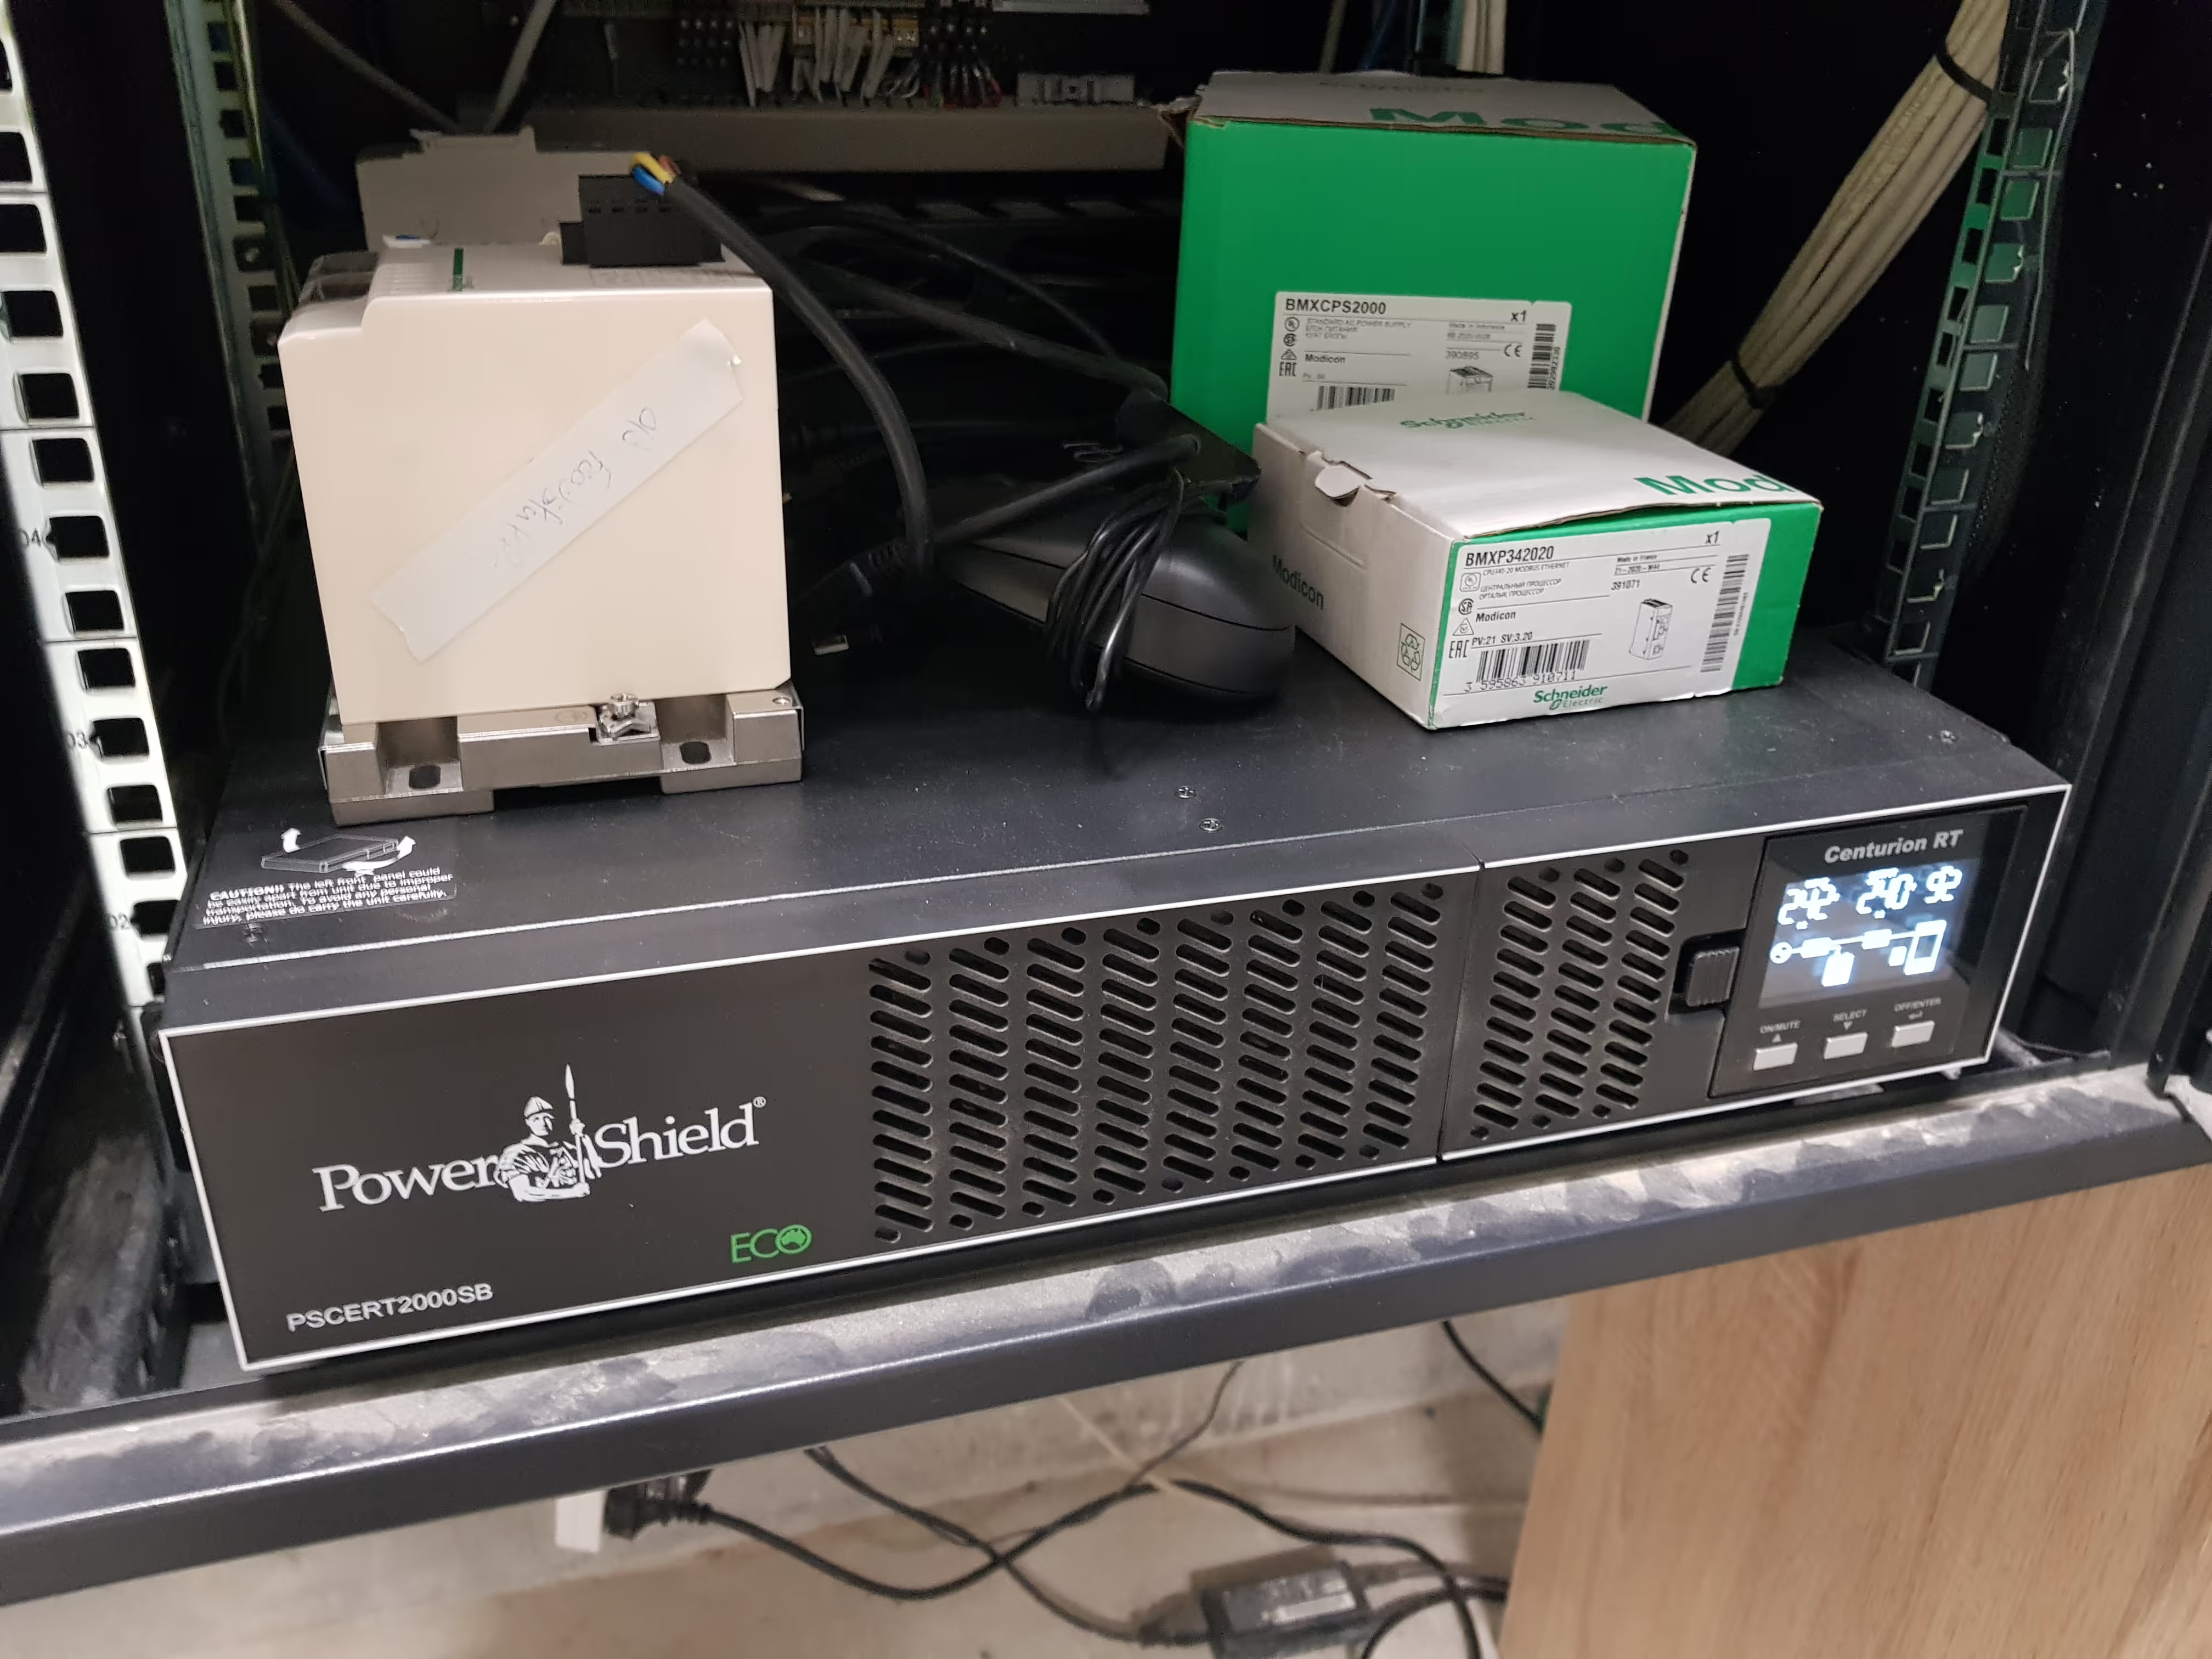
  • Splunk SNMP Streaming provided live data on UPS runtimes, utilisation, and operational status (utility, battery, or bypass).
  • NetBox Datacentre Modeller contributed static data such as UPS models, capacities, service history, and battery pack requirements.
  • All data was structured and stored in a PostgreSQL database, replacing the unreliable spreadsheet with a robust, queryable backend.
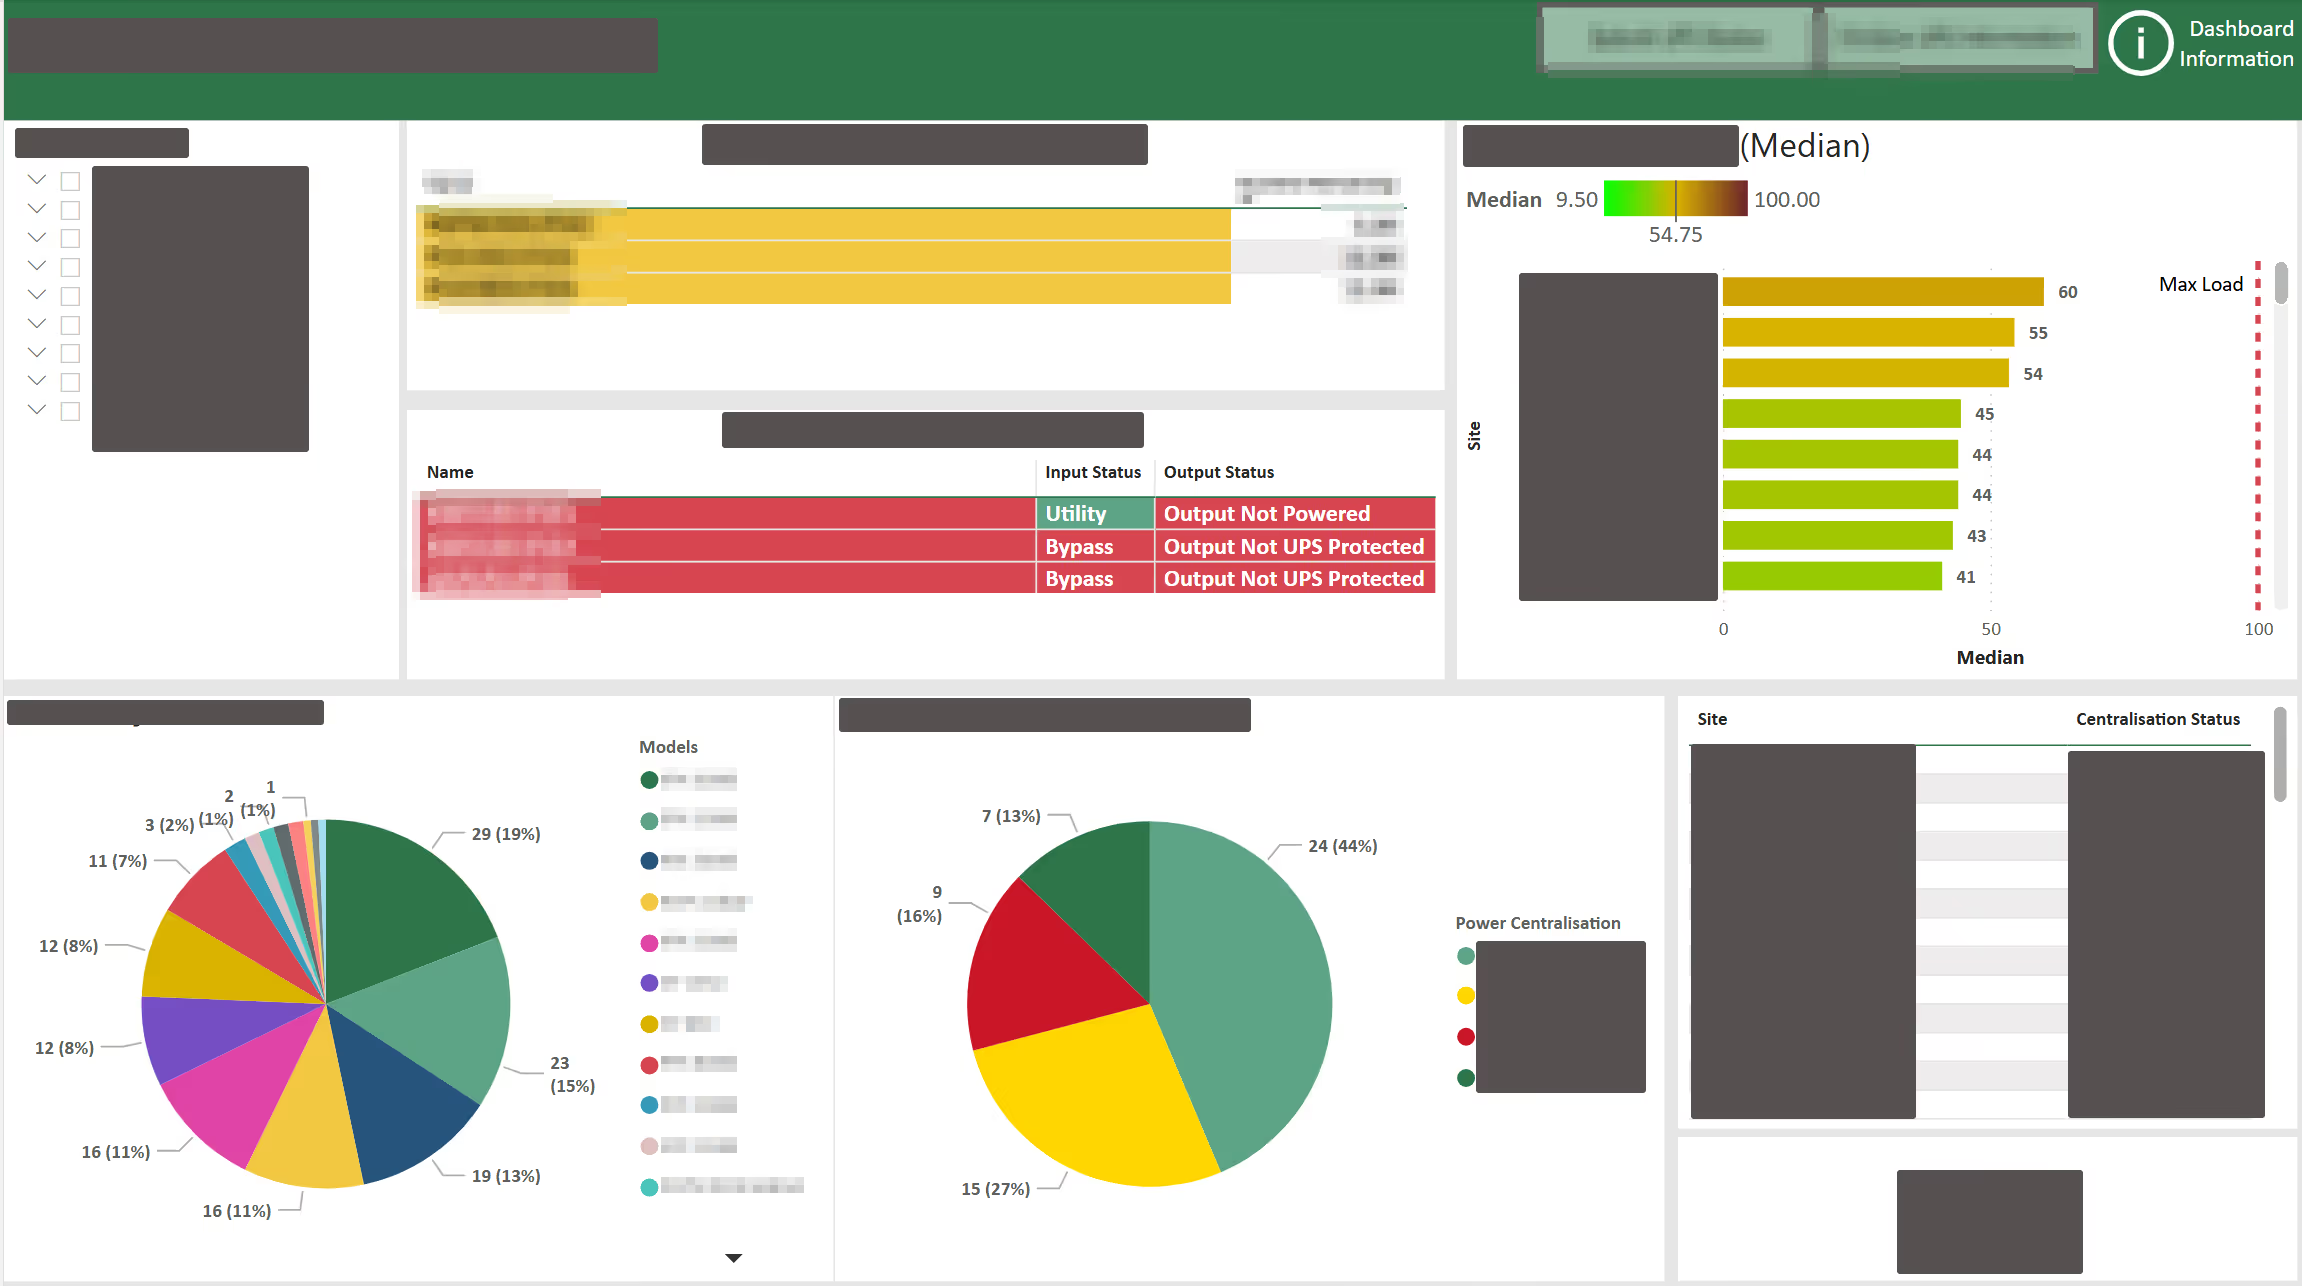
The Power BI Dashboard we built for Site Power Management

The Power BI dashboard brought it all together, offering:

  • Real-time visibility into UPS health across all sites, answering significant operational questions such as
    • Which sites were at risk from power overload?
    • Which sites had less than the agreed system runtime in the event of a power blackout?
    • How many power failures had a site experienced over the last x number of days, weeks, months or years?
  • Preventative maintenance forecasting up to 12 years in advance
  • Clear indicators for battery health, next service due, and operational status
  • Interactive filtering by region, model or service window

Why It Matters

This wasn’t just a dashboard. it was a shift from reactive to proactive infrastructure management. By structuring the data and automating the flow from Splunk and NetBox, the organisation gained:

  • Confidence in data accuracy
  • Reduced risk of outages
  • Improved planning and budgeting
  • Time saved from manual updates and checks